Aave (AAVE) has been experiencing significant price fluctuations, driven by shifts in market sentiment and accumulation patterns. After surging to $400 in December 2024, the asset faced a sharp decline, dropping below $200 in early 2025. As technical indicators hint at a possible momentum shift, AAVE’s trajectory remains at a pivotal stage.

AAVE’s Current Market Position
According to Smart DEX Traders, AAVE has entered an accumulation phase following its price drop. As of the latest 1-hour candlestick chart, AAVE/USDT is trading at $193.31, reflecting a 0.75% decline. The price range extends from a high of $194.19 to a low of $191.16, indicating persistent selling pressure.
Technical indicators show a bearish trend, with the 10-period EMA at $185.73 sitting below the 50-period EMA at $188.32. However, a spike in trading volume to 6.026M suggests heightened activity, potentially signaling a shift in momentum. The Cumulative Volume Delta (CVD) has dropped to -98.367K, reinforcing selling dominance.
Despite this, the Rate of Change (ROC) at 9.10 and the MACD at 1.72 indicate that bullish momentum could be building. If buying activity intensifies, AAVE might rebound toward the $200 mark. Conversely, continued selling pressure could drive prices below $180, with the next support level at $171.50.
Cumulative Volume and Price Correlation
Historical data from Smart DEX Traders highlights the correlation between cumulative volume and price movement. AAVE’s price surged to $400 in September 2024 when cumulative volume peaked at 15K tokens. However, as volume declined to -10K in January 2025, AAVE’s price bottomed out at $171.50.
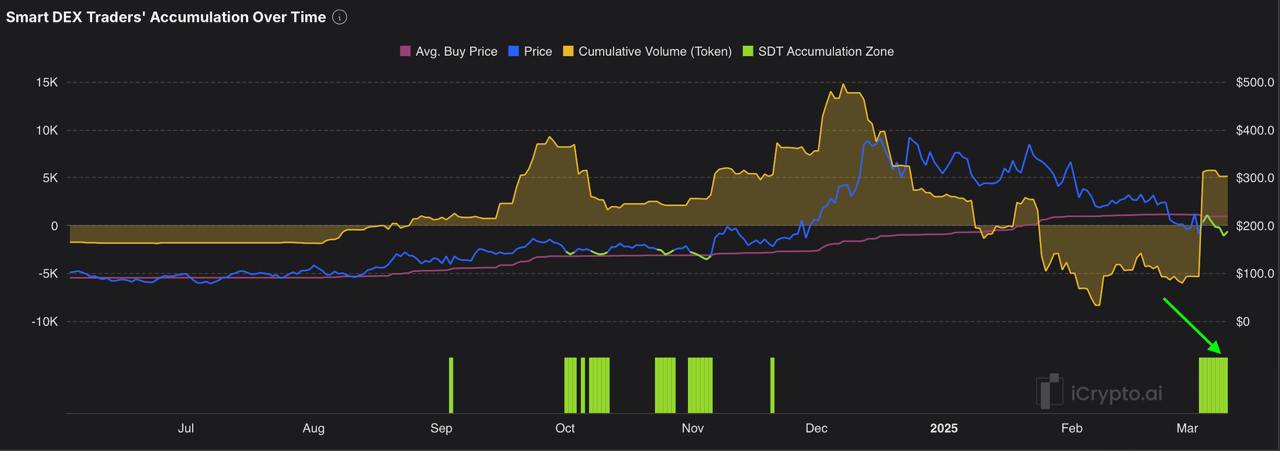
By March 2025, cumulative volume had rebounded to 5K, suggesting renewed accumulation. If volume sustains this level, AAVE could see upward pressure toward $250. However, a drop below zero may signal a decline to $150, reflecting bearish sentiment.
Market Sentiment and Netflow Trends
Netflow data from Coinglass further underscores AAVE’s market trends. In July 2024, netflow peaked at $15M, coinciding with a price rise to $300. However, a significant outflow of -$20M in January 2025 triggered a decline to $171.13. By March 2025, netflow turned positive at $5M, hinting at renewed buying interest.
If netflow surpasses $10M alongside sustained trading volume above 6M, AAVE could climb toward $250. Conversely, a negative netflow of -$5M may push prices down to $150, testing key support levels.
Also Read: AAVE Price Analysis: Bearish Momentum Signals Potential Correction Amid Resistance at $270
AAVE’s technical indicators and on-chain data suggest a possible rebound if positive trends continue. The current netflow of $5M, combined with increased volume, indicates bullish momentum. If historical trends hold, AAVE might revisit the $250 level. However, a decline in trading activity or a shift in netflow could lead to further downside pressure, testing support at $150. Traders should closely monitor volume trends and netflow to anticipate potential price movements.
Disclaimer: The information in this article is for general purposes only and does not constitute financial advice. The author’s views are personal and may not reflect the views of CoinBrief.io. Before making any investment decisions, you should always conduct your own research. Coin Brief is not responsible for any financial losses.