Chainlink (LINK) has experienced a significant downturn since reaching its cycle high of $30.95 in December 2024. The price drop has invalidated its previous long-term breakout, with LINK hitting a 2025 low of $11.87 on March 11. As the price now hovers near a key support trend line, investors are closely watching whether LINK will rebound or confirm the start of a bearish trend.
LINK Price at a Crucial Support Level
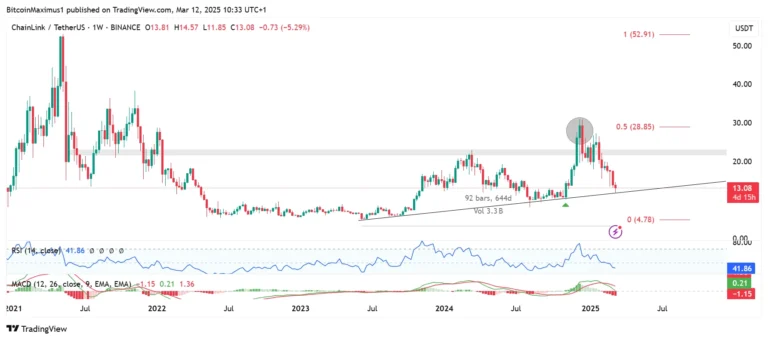
The weekly chart indicates that LINK has been moving along an ascending support trend line since June 2023. This trend line has historically acted as a strong support level, allowing LINK to stage multiple recoveries. In November 2024, the price briefly broke above the long-term resistance of $22.50 but failed to sustain momentum, falling back below it.
Moreover, LINK’s rejection at the 0.5 Fibonacci retracement level suggests that the recent rally was a corrective move rather than the start of a sustained uptrend. The current price action sees LINK testing the long-standing support line for the second time, a crucial moment that could determine its next major move.
Bearish Technical Indicators and Wave Count
Technical indicators signal a bearish outlook. The Relative Strength Index (RSI) is below 50, and the Moving Average Convergence/Divergence (MACD) has made a bearish cross—both indicators suggesting downward momentum.
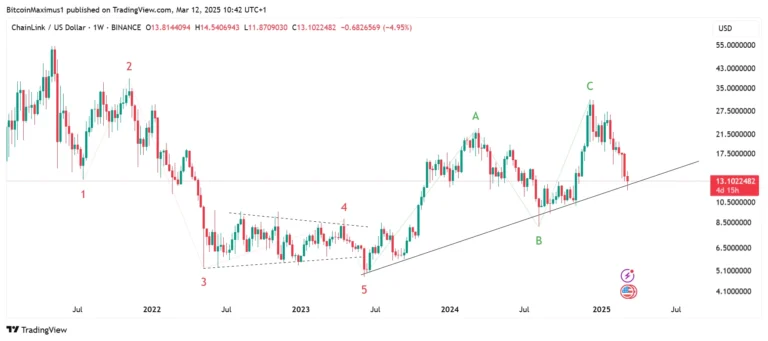
From a wave count perspective, LINK’s recent price structure resembles an A-B-C corrective pattern following a five-wave downward movement from its all-time high. If this count holds, LINK could break below its long-term support and initiate a further decline.
Could a Short-Term Bounce Be on the Horizon?
Despite the prevailing bearish trend, there are signs of a potential short-term bounce. LINK is currently trading within a descending parallel channel, a formation that often leads to breakouts. Additionally, the daily RSI and MACD have generated bullish divergences, typically signaling an impending price increase.
If LINK manages to bounce, the first resistance will be at $16.30, followed by a stronger barrier at $20.50. However, a failure to reclaim these levels could accelerate the downward trajectory.
Also Read: Chainlink (LINK) Retraces After U.S. Crypto Reserve Pump – What’s Next for Investors?
Chainlink’s long-term trend appears bearish due to its inability to hold above $22.50. A breakdown from the long-term support trend line would confirm this outlook. However, a short-term bounce remains possible, offering traders an opportunity to capitalize on temporary price movements before LINK resumes its downward trend.
Disclaimer: The information in this article is for general purposes only and does not constitute financial advice. The author’s views are personal and may not reflect the views of CoinBrief.io. Before making any investment decisions, you should always conduct your own research. Coin Brief is not responsible for any financial losses.