Hamster Token (HMSTR) appears to be on the brink of a strong recovery after enduring a lengthy corrective phase that spanned several months. With both the macro and lower time frames aligning for a potential bullish trend, HMSTR is at a critical pivot point, readying for its next impulsive leg upward.
HMSTR Price Analysis: A Breakout in Progress
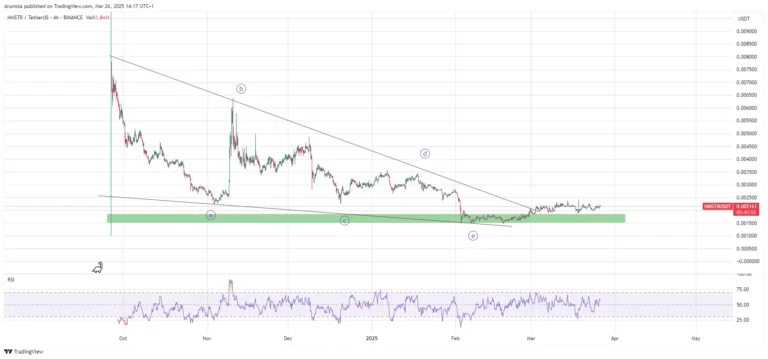
A closer look at the 4-hour chart reveals a descending triangle formation that developed from the high of $0.0080, forming an A-B-C-D-E correction. The final E wave concluded with a slight bullish divergence on the Relative Strength Index (RSI), establishing a strong base within the green accumulation zone between $0.00144 and $0.00163.

Following this, HMSTR experienced a decisive breakout from the descending triangle, suggesting an end to the correction phase. The token is now consolidating above the triangle’s upper boundary, with RSI climbing above neutral territory—signaling increasing momentum.
Currently, HMSTR is trading above $0.0020, positioning itself for a potential surge. If the uptrend continues, key price targets include $0.00240, $0.00273, and $0.00327, aligning with the bullish macrocycle outlook.
HMSTR Price Prediction: Elliott Wave Signals Further Upside
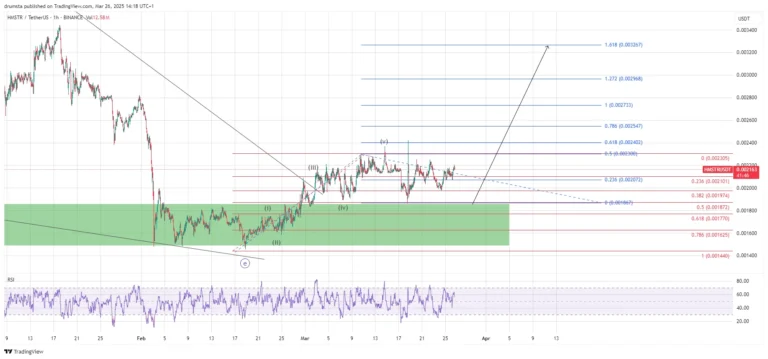
On the 1-hour chart, HMSTR exhibits a completed five-wave impulse from its February low, followed by a sideways correction. This consolidation likely represents a higher-degree wave 2, setting the stage for a strong upward movement.
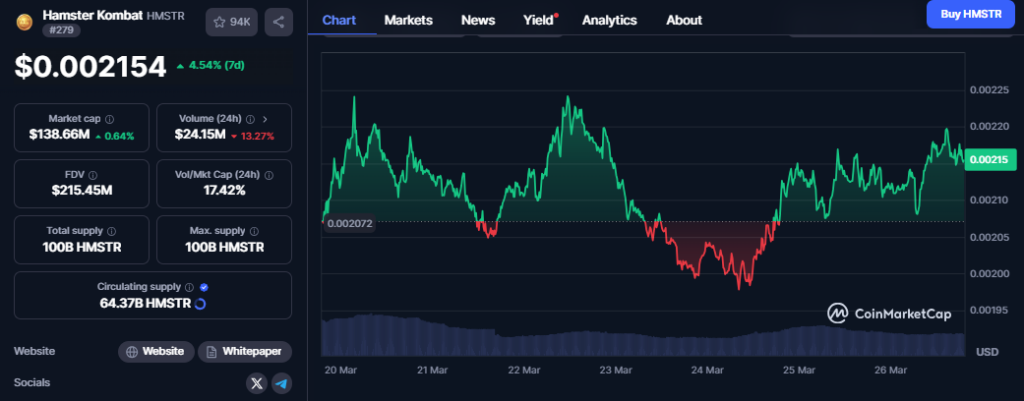
The RSI remains in mid-range, indicating room for further price appreciation. Presently, HMSTR is hovering around $0.00216, supported by a local cluster between $0.00201 (0.236 retracement) and $0.00187 (0.5 retracement).

A potential impulsive wave (iii) could extend towards $0.00273 (1.0 extension) or even $0.00327 (1.618 extension), depending on market strength. If the wave count holds, any short-term pullbacks to the $0.00187 zone could offer reentry points before the next rally. However, a drop below $0.00177 (0.618 Fibonacci retracement) would challenge the bullish setup and potentially lead to further declines.
Key Levels to Watch
- Immediate Resistance: $0.00230 (0.5 Fibonacci level)
- Key Resistance: $0.00273 (1.0 Fibonacci extension)
- Major Resistance: $0.00327 (1.618 Fibonacci extension)
- Immediate Support: $0.00201 (0.236 Fibonacci retracement)
- Critical Support: $0.00177 (0.618 Fibonacci retracement)
- Short-Term Target for Wave (iii): $0.00273–$0.00327
- Invalidation Zone: Below $0.00177
Also Read: Pi Network Price Skyrockets 157% – Can It Hit $5 Before March 31?
With technical indicators supporting a bullish continuation, HMSTR appears poised to challenge higher resistance levels in the coming weeks. Investors should watch for volume spikes and price action around key Fibonacci levels to confirm the next leg of the uptrend.

Disclaimer: The information in this article is for general purposes only and does not constitute financial advice. The author’s views are personal and may not reflect the views of CoinBrief.io. Before making any investment decisions, you should always conduct your own research. Coin Brief is not responsible for any financial losses.


