Hedera (HBAR) is showing mixed signals as technical indicators suggest both bearish pressure and a potential bullish reversal. The Ichimoku Cloud hints at an upcoming breakout, while the BBTrend indicator reveals a failed bullish attempt. Traders are closely watching key resistance and support levels to determine HBAR’s next move.
BBTrend Indicates Renewed Bearish Pressure
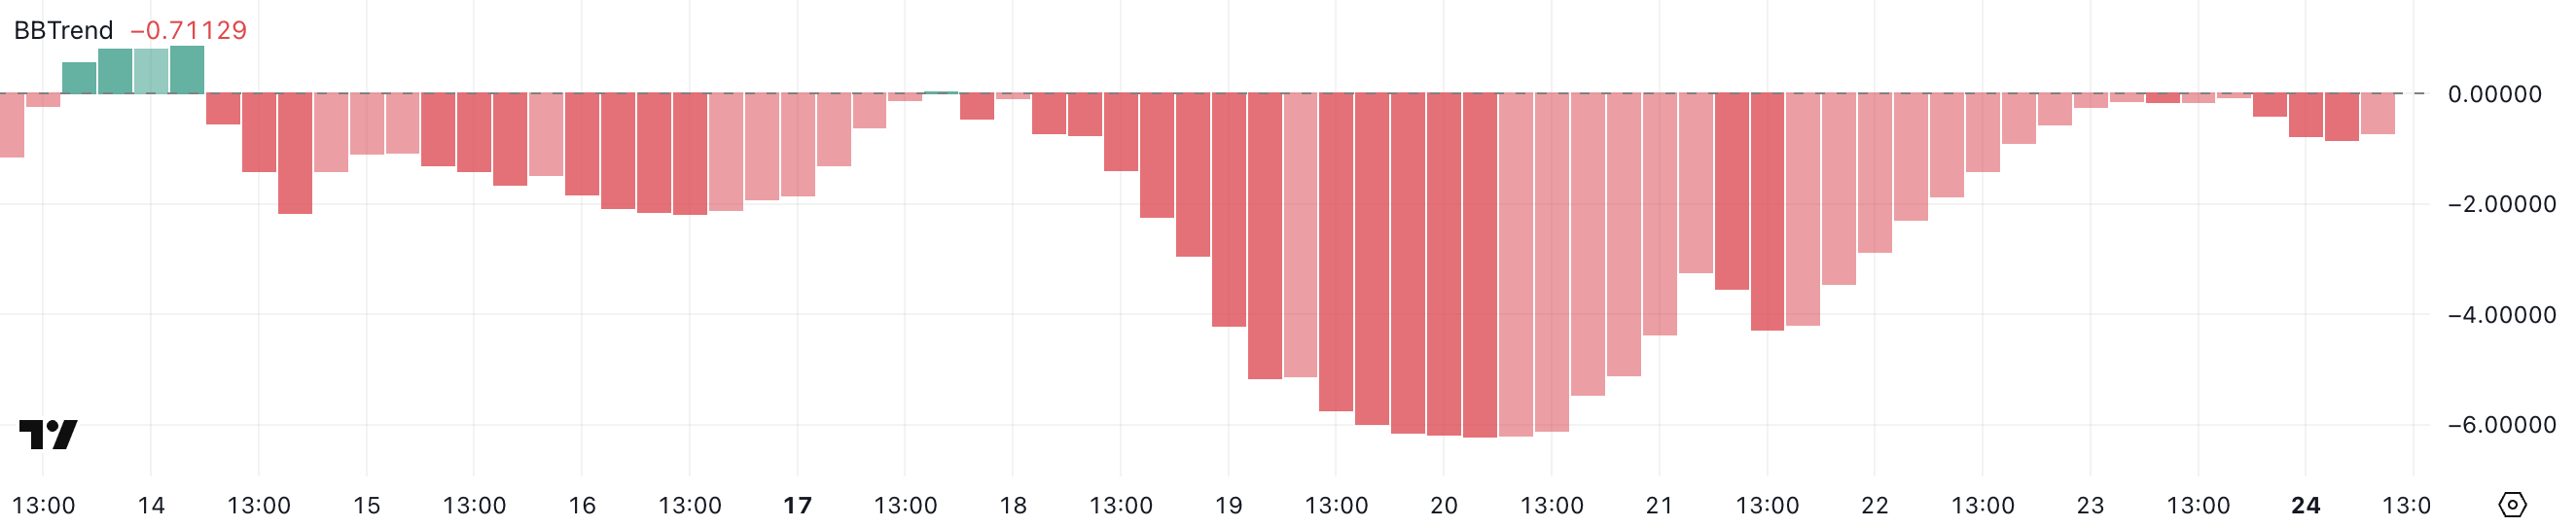
HBAR’s BBTrend is currently at -0.71, marking a return to bearish sentiment after briefly recovering to -0.06. This suggests that selling pressure is regaining strength. The BBTrend indicator, which measures price movement relative to Bollinger Bands, turned negative on February 18 and reached a low of -6.21 on February 20 before showing signs of recovery.
However, the latest drop indicates that bullish attempts have not been sustained. If BBTrend remains negative, HBAR could see further declines, potentially testing key support levels at $0.19. A break below this support could push the price down to $0.179.
Ichimoku Cloud Shows Potential Bullish Reversal
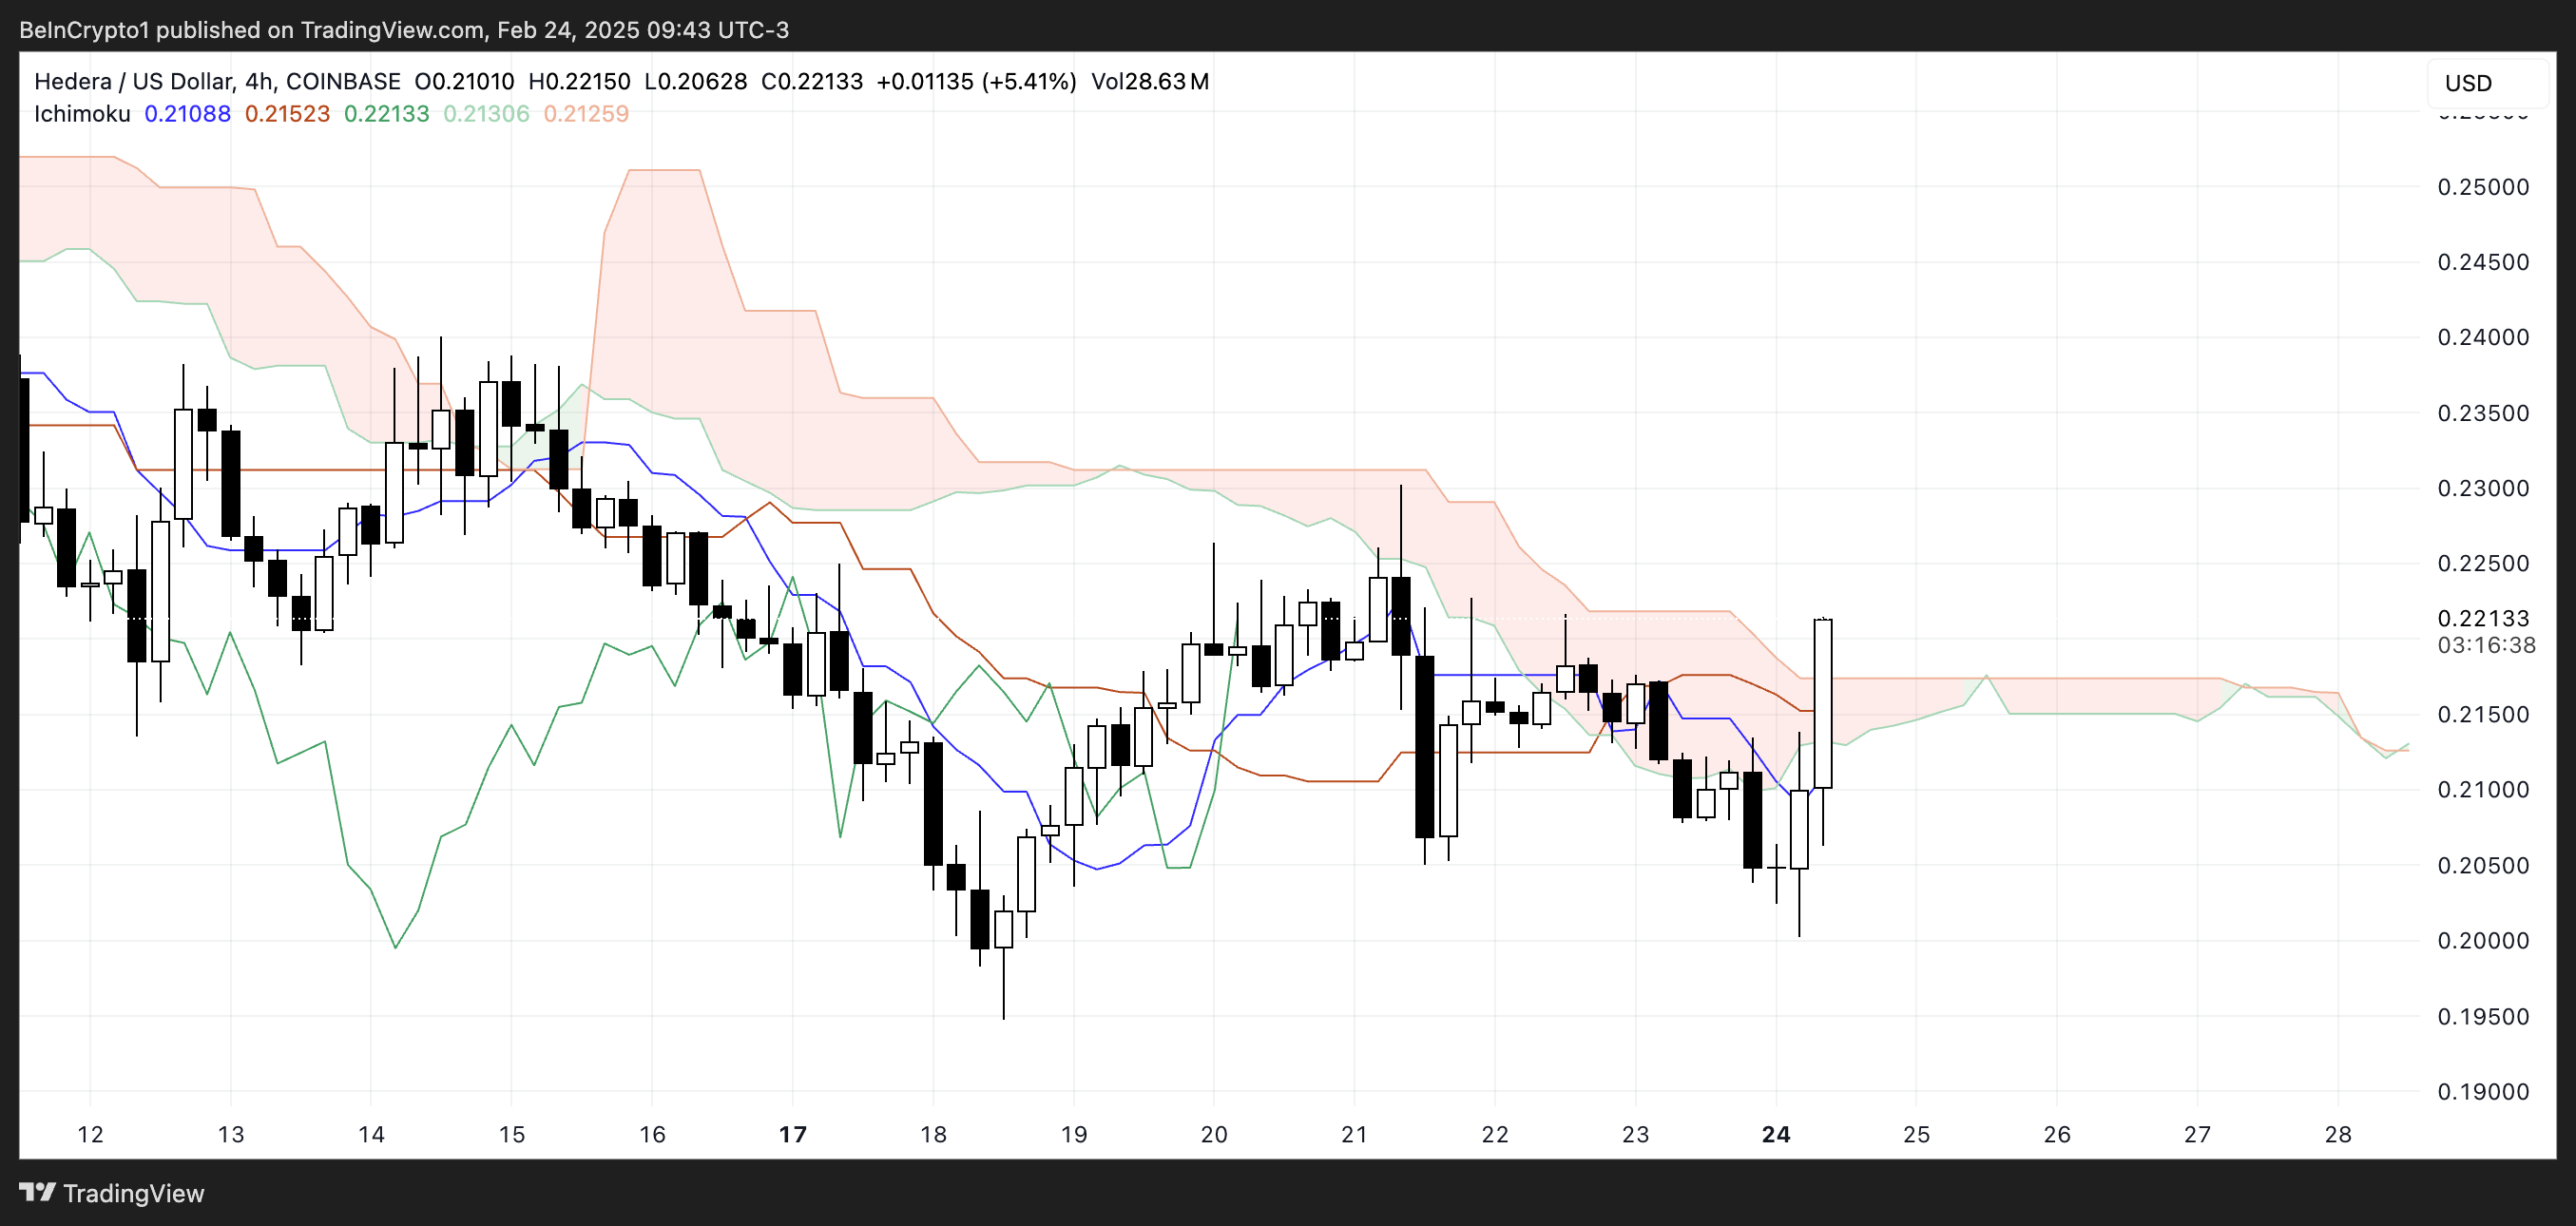
The Ichimoku Cloud presents a contrasting outlook. HBAR has recently broken above the cloud, which typically signals a bullish trend. However, the cloud ahead is thin and slightly bearish, indicating weak resistance and potential indecision among traders.
Additional indicators show mixed signals. The blue Tenkan-sen line is positioned above the red Kijun-sen line, suggesting short-term bullish momentum. Meanwhile, the green Chikou Span remains above the price, reinforcing a positive sentiment. However, the narrow gap between the Tenkan-sen and Kijun-sen suggests that the bullish trend is not yet fully confirmed.
Key Levels to Watch: Can HBAR Break $0.30?
If HBAR’s short-term EMA lines cross above the long-term EMAs, buying momentum could push the price to test resistance at $0.24. A successful breakout above this level may drive HBAR to $0.29, with a potential surge to $0.32 if bullish momentum persists. This would mark its first move above $0.30 since February 1.
Conversely, failure to sustain bullish momentum could see HBAR retesting support at $0.19. A breakdown below this level would confirm extended bearish momentum, pushing prices toward $0.179.
Also Read: PI Price Poised for Breakout: Key Levels & Fibonacci Targets to Watch
HBAR traders should remain cautious as indicators show conflicting signals. While the Ichimoku Cloud suggests a potential breakout, the BBTrend points to renewed selling pressure. A decisive move above $0.24 could pave the way for a rally, while failure to hold support at $0.19 could deepen losses. Market participants should monitor key technical levels for confirmation of HBAR’s next trend direction.
Disclaimer: The information in this article is for general purposes only and does not constitute financial advice. The author’s views are personal and may not reflect the views of CoinBrief.io. Before making any investment decisions, you should always conduct your own research. Coin Brief is not responsible for any financial losses.