After dipping below $6 last Monday, MANTRA (OM) has staged a recovery, reaching $6.84 and edging closer to the $7 mark. However, the bullish momentum appears to be weakening, raising concerns about a potential price pullback.
OM’s Bullish Setup Faces Resistance
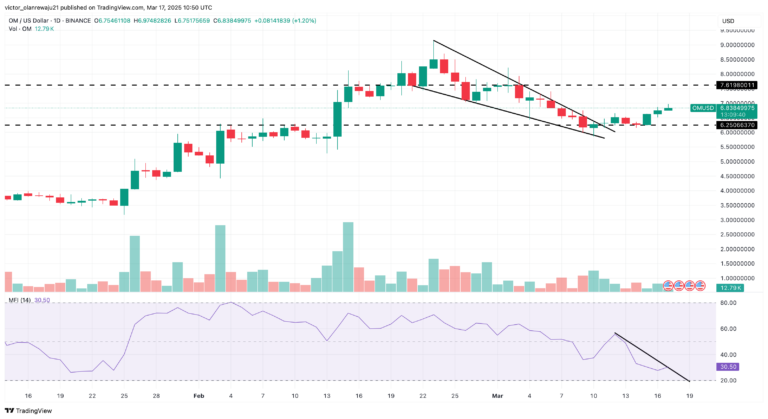
OM’s price decline from its February 23 high of $8.99 formed a falling wedge pattern—a typically bullish formation that suggests a breakout to the upside. OM validated this pattern with its recent rise, giving hope for further gains. However, technical indicators suggest that sustaining this momentum may prove difficult.
One key indicator, the Money Flow Index (MFI), tracks buying and selling pressure. A rising MFI signals increased buying interest, while a falling MFI indicates selling pressure. Despite OM’s price increase, the MFI has declined, signaling a bearish divergence and suggesting that the recent recovery might not hold.
Potential Pullback for OM
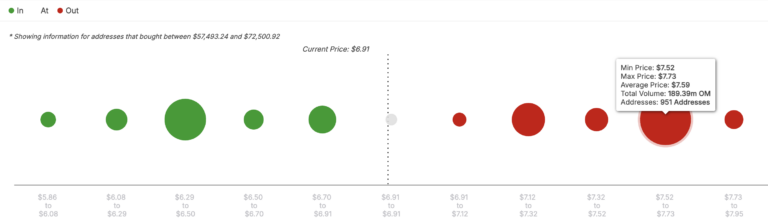
If selling pressure continues to mount, OM could struggle to break the $7.62 resistance level. On-chain data from IntoTheBlock supports this bearish outlook, showing that 951 addresses have accumulated nearly 190 million OM tokens in the $7.52 to $7.73 price range. This suggests a significant sell wall that could limit upward movement.
Should OM fail to breach this resistance, the token may retrace toward the $6.25 support level. A further breakdown could push OM lower to $5.18, as indicated by Fibonacci retracement levels.
Bear Flag Signals Extended Downtrend
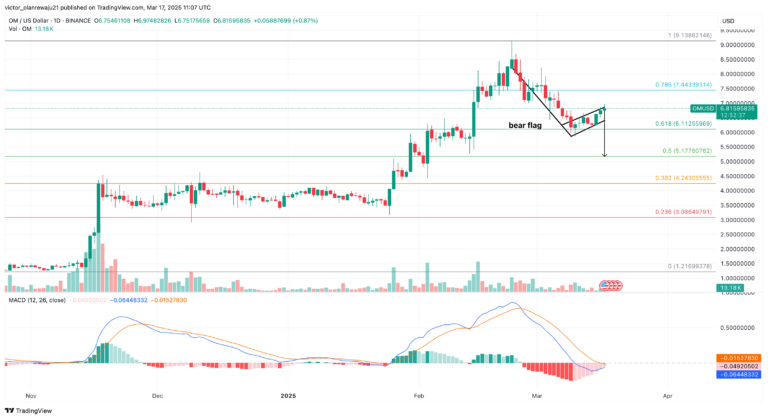
Adding to concerns, OM’s price action has also formed a bear flag pattern. This structure typically signals a continuation of the downtrend following a temporary rebound. Moreover, the Moving Average Convergence Divergence (MACD) indicator currently shows a negative reading, reinforcing the bearish outlook.
However, if the MACD reading turns positive, OM could regain momentum and target the 0.786 Fibonacci level at $7.44. A successful breakout above this level could propel OM toward a new all-time high of $9.14.
Also Read: Pi Network Price Skyrockets 157% – Can It Hit $5 Before March 31?
While OM’s recent recovery is encouraging, key resistance levels and weakening buying pressure suggest a potential pullback. Traders should monitor price action closely, as a failure to maintain bullish momentum could lead to further declines.
Disclaimer: The information in this article is for general purposes only and does not constitute financial advice. The author’s views are personal and may not reflect the views of CoinBrief.io. Before making any investment decisions, you should always conduct your own research. Coin Brief is not responsible for any financial losses.