
ONDO’s recent market performance suggests a phase of uncertainty, with key indicators pointing to a weakening trend and fading buying pressure. Whether ONDO breaks out of its consolidation phase or continues moving sideways will depend on its ability to regain momentum in the coming sessions.
The Directional Movement Index (DMI) chart for ONDO reveals an Average Directional Index (ADX) of 10.7, remaining below the critical 15 level for five consecutive days. Typically, an ADX reading below 20 indicates a lack of strong trend direction, while values above 25 suggest a well-established movement. Since ONDO’s ADX has remained low, the market continues to consolidate without a clear bullish or bearish momentum.
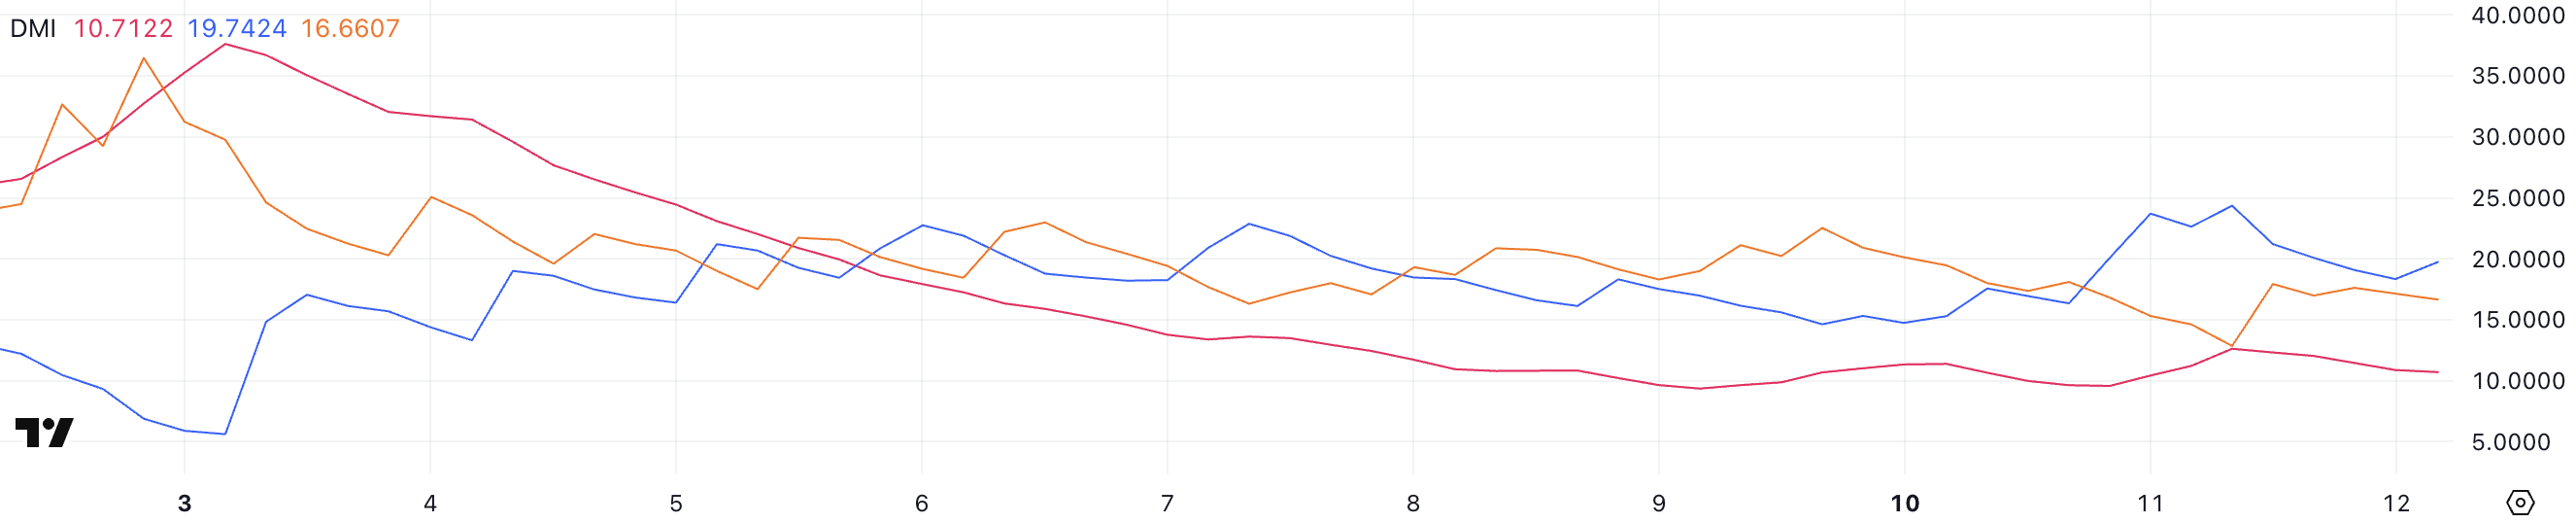
Additionally, the +DI has declined from 24.2 to 19.7, while the -DI has risen from 12.8 to 16.6. This subtle shift in directional strength suggests slight changes in buying and selling pressure but lacks the momentum needed for a decisive breakout. With these indicators stabilizing, ONDO’s price action remains in a tight range, waiting for stronger directional confirmation.
ONDO CMF Struggles to Stay Positive
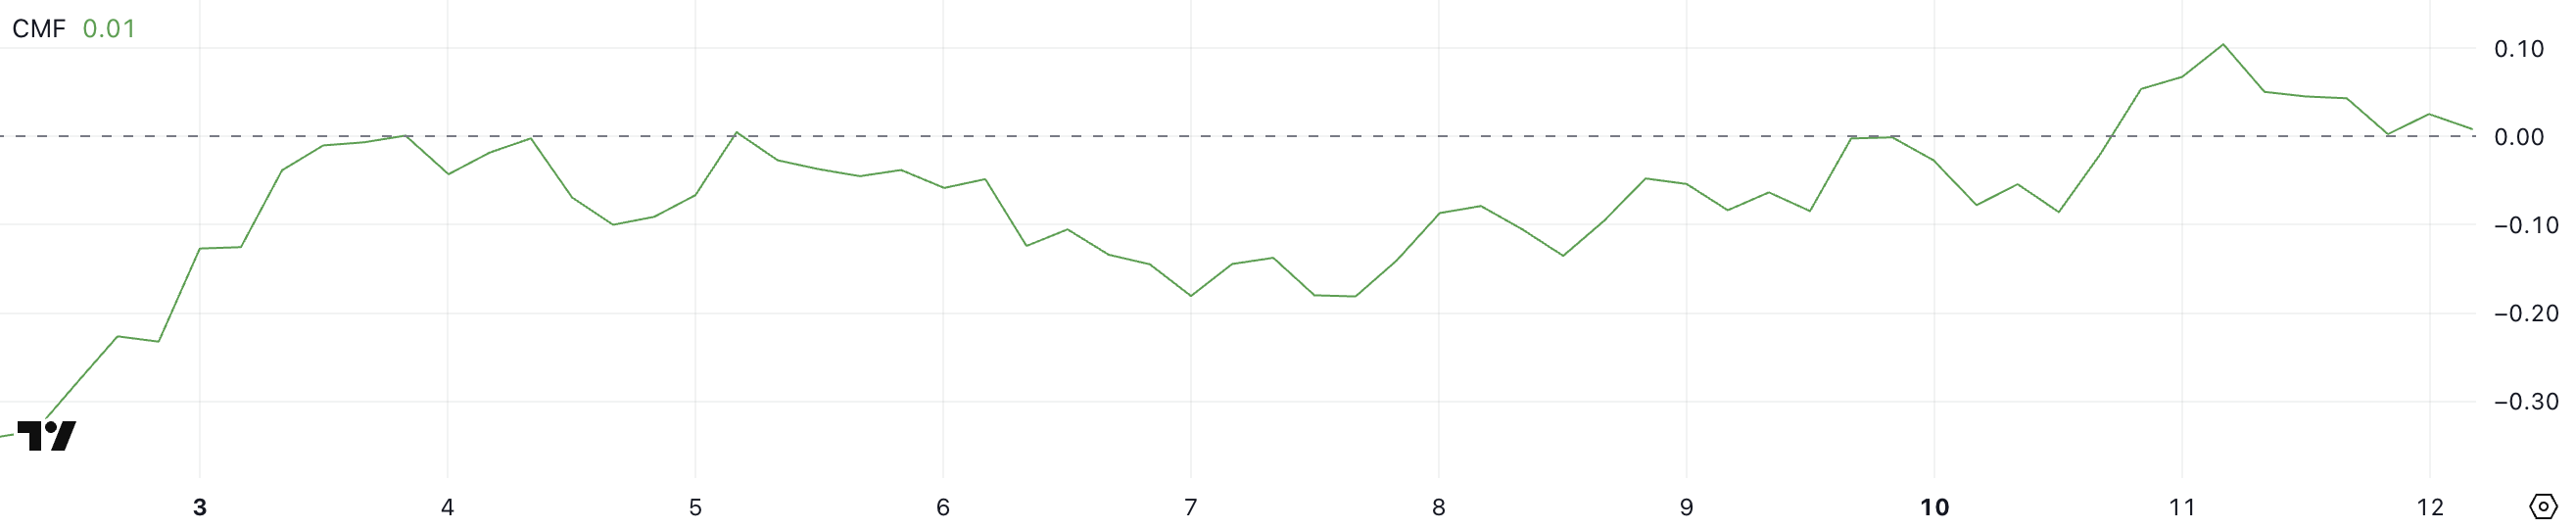
ONDO’s Chaikin Money Flow (CMF) currently stands at 0.01, down from 0.1 over the past day, following nearly two weeks in negative territory between January 31 and February 10. The CMF measures buying and selling pressure, with values above zero indicating accumulation and those below zero signaling distribution.
A declining CMF suggests weakening bullish momentum, and with ONDO struggling to maintain positive territory, buying pressure appears to be fading. If the CMF dips back below zero, renewed selling pressure could push ONDO’s price lower or extend the consolidation phase.
ONDO Price Prediction: Consolidation or Breakout?
ONDO has been trading within a narrow range between $1.38 and $1.31, even after announcing its Layer-1 development. Its EMA lines remain closely aligned, signaling indecisiveness in the market. Despite a sharp correction from $1.60 to $1.13 between January 30 and February 2, ONDO still holds a $4.2 billion market cap as one of the leading RWA tokens.
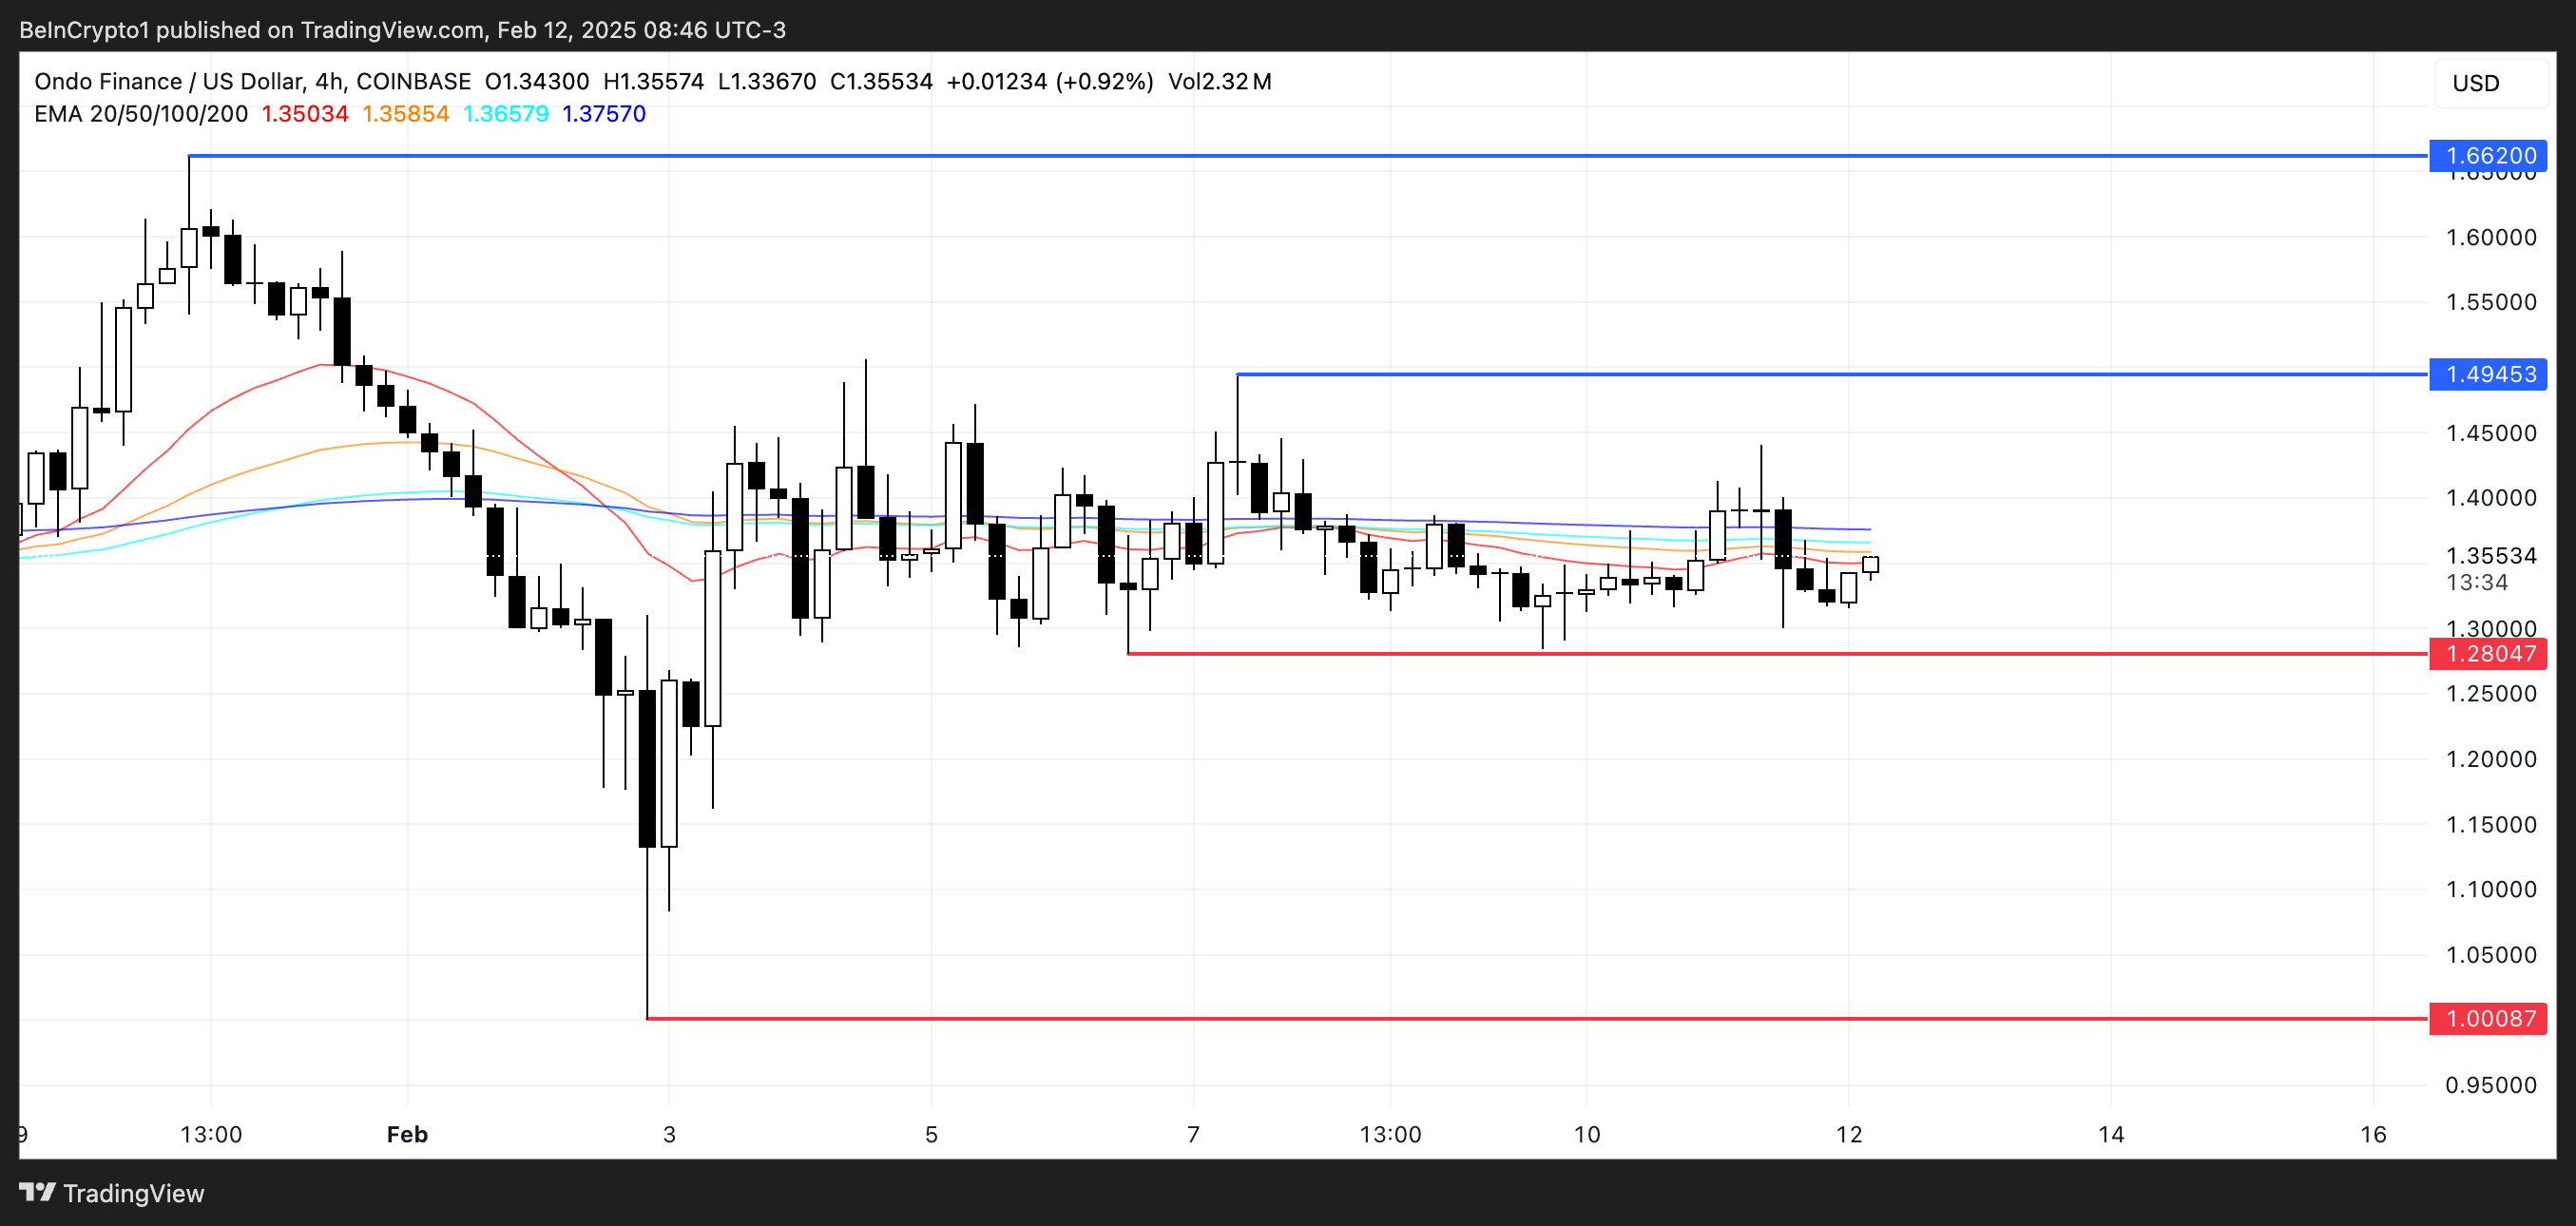
If ONDO gains bullish momentum, it could first test resistance at $1.49, with a potential push toward $1.66. However, if bearish pressure prevails and support at $1.28 fails, the price may extend its decline toward $1.00. Investors should watch for ADX and CMF movements as key signals for ONDO’s next move.
Disclaimer: The information in this article is for general purposes only and does not constitute financial advice. The author’s views are personal and may not reflect the views of CoinBrief.io. Before making any investment decisions, you should always conduct your own research. Coin Brief is not responsible for any financial losses.
Also Read: Ondo Finance Launches Ondo Chain: A Game-Changer for RWAs