PEPE, one of the leading meme coins in the crypto market, has shown surprising short-term resilience, gaining 3.5% in the last 24 hours to trade at $0.00001110, according to CoinMarketCap. However, analysts warn that the bullish momentum could be short-lived, with several technical indicators flashing red and a major whale deposit suggesting profit-taking may be underway.
Bull Flag or Bear Trap?
PEPE has been trading within a descending channel since May 10, which has now formed a classic bull flag pattern—a structure typically seen as bullish when it follows a strong upward move. The meme coin previously surged from $0.0000079 to $0.000015 before consolidating between $0.000010 and $0.000014.
Yet, this potential breakout is being tested. The Chaikin Money Flow (CMF) is currently below zero, indicating capital outflows and growing selling pressure. Complementing this bearish signal is the Balance of Power (BoP) reading of -0.52, which reflects a clear dominance of sellers in the market.
To make matters worse, a death cross has formed with the 50-day EMA crossing below the 20-day EMA, signaling weakening buyer interest and increasing downside risks.
Whale Moves Fuel Speculation of Sell-Off
A major red flag was raised after on-chain tracker TheDataNerd reported that wallet 0x6ea deposited 609 billion PEPE tokens (worth ~$6.43 million) into Binance. Despite this transfer, the whale still retains 1.21 trillion PEPE (~$12.77 million) in their portfolio.
1 hour ago, a whale 0x6ea deposited 609B $PEPE (~$6.43M) into #Binance
— The Data Nerd (@OnchainDataNerd) June 13, 2025
Just now, he still owns 1.21T $PEPE (~$12.77M)
Address:https://t.co/KwoIwhTtL7 pic.twitter.com/XmOt62QDs5
Large centralized exchange (CEX) deposits often precede profit-taking or distribution events, which could explain the more than 40% drop in trading volume over the past day. This sudden shift in trading activity may hint at an incoming price correction if bulls fail to hold key levels.
Technical Indicators Signal Caution
The Relative Strength Index (RSI) sits at 47, slightly below the neutral 50 mark, indicating tepid buying interest. At the same time, the MACD is crossing into bearish territory, with the MACD line slipping under the signal line, showing a lack of bullish momentum.
From a Fibonacci perspective, PEPE is hovering between the 0.382 level ($0.00001325) and the 0.236 level ($0.00001202). If the price breaks below the $0.000010 support, it could slide toward $0.00000888 or even $0.0000079, the level where the last rally began.
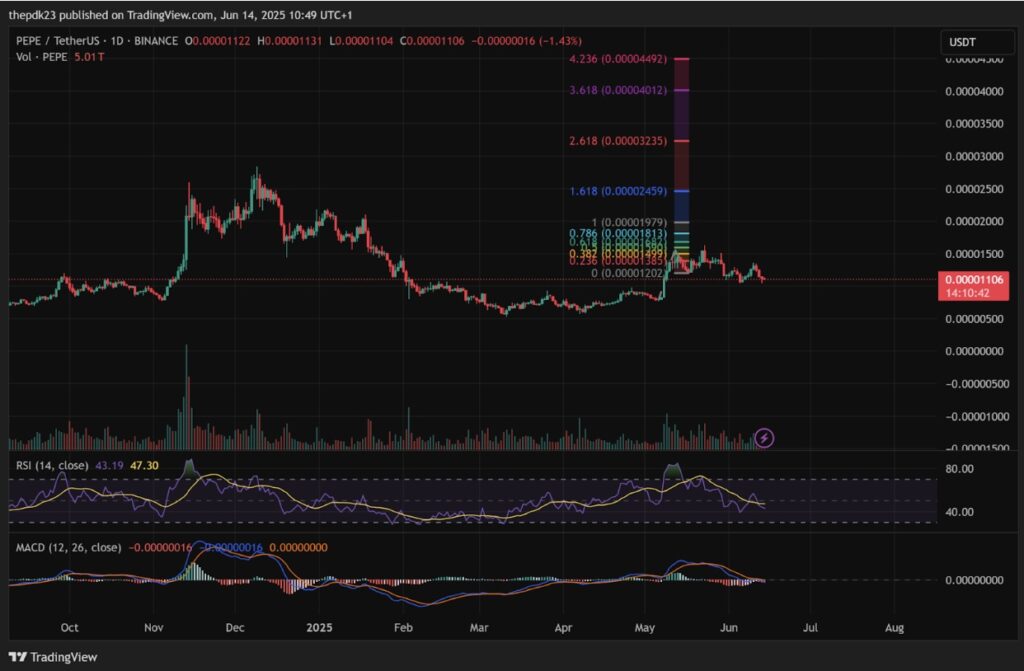
Still, a bullish breakout above $0.000014 could ignite renewed interest and push PEPE toward $0.000016, with possible Fibonacci extension targets of $0.0000245 (1.618) and $0.0000323 (2.618)—though such a move would require a substantial shift in market sentiment.
Also Read: Whale Reignites Bullish Momentum: PEPE Surges as $13.9M Bet Signals Breakout Potential
Disclaimer: The information in this article is for general purposes only and does not constitute financial advice. The author’s views are personal and may not reflect the views of CoinBrief.io. Before making any investment decisions, you should always conduct your own research. Coin Brief is not responsible for any financial losses.