
Polkadot (DOT) has emerged from a prolonged downtrend, showing signs of a potential bullish recovery. The recent breakout from a descending wedge on the 4-hour chart suggests a possible trend reversal, with Fibonacci levels and Elliott Wave analysis providing insight into the next price movements.
DOT Price Analysis: A Key Breakout
DOT has been in a corrective phase since reaching a high of $11, forming an ABCDE correction within a falling wedge pattern. The final wave (e) appears to have bottomed at approximately $3.60, near the 1.0 Fibonacci retracement level, indicating a near 100% correction.
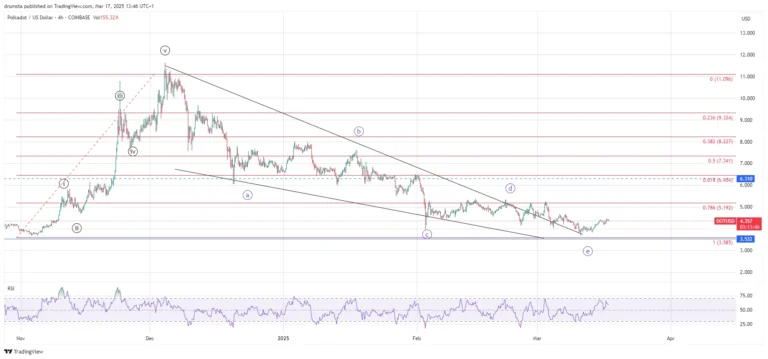
Following this breakout, DOT is now eyeing higher Fibonacci retracement levels. The first major resistance lies at $5.19, which coincides with the 0.786 Fibonacci retracement from the prior downtrend. A successful breach of this level with strong volume could confirm a larger bullish reversal, pushing the price toward $6.45 (0.618 Fibonacci level).
On the 4-hour chart, the Relative Strength Index (RSI) is recovering from oversold territory, signaling renewed buying interest. However, if DOT fails to sustain above $4.00–$4.10 (0.618 Fibonacci retracement of the latest move), another corrective leg could emerge before sustained upside momentum.
Elliott Wave Analysis and Short-Term Outlook
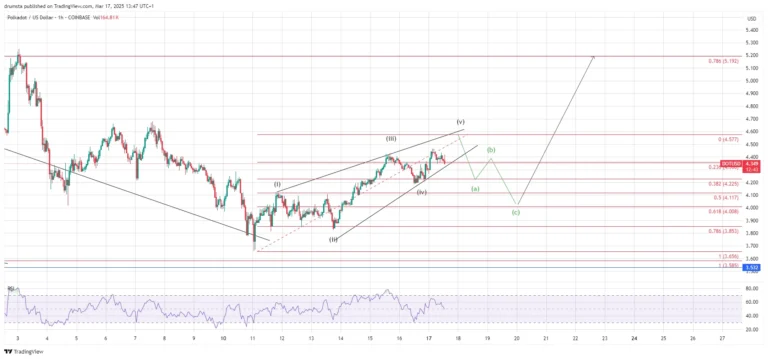
The 1-hour chart suggests that DOT is currently within a five-wave impulse structure. Waves (i) through (iv) are complete, with wave (v) targeting the $4.57–$4.60 range—an area that aligns with local resistance.
After completing this five-wave impulse, a corrective (a)-(b)-(c) retracement is expected, likely bringing DOT back toward $4.00–$4.12. If this level holds as support, it would reinforce the bullish structure and set the stage for a breakout above $4.60, potentially leading to a rally toward $5.19. A continuation above this level could propel DOT toward $6.45.
However, failure to hold the $4.00–$4.10 support zone could invalidate the bullish outlook, leading to a deeper correction toward the $3.85–$3.58 range.
Key Levels to Watch
- Immediate Resistance: $4.57 – $4.60 (local structure resistance)
- Major Resistance: $5.19 (0.786 Fibonacci retracement)
- Immediate Support: $4.12 – $4.00 (0.618 Fibonacci retracement)
- Critical Support: $3.85 – $3.58 (descending wedge breakout level)
- Breakout Target: Above $5.19, aiming for $6.45 (0.618 macro Fibonacci retracement)
Also Read: Cardano, Polkadot, and Avalanche Face Major Sell-Off: Is This a Buying Opportunity?
As long as DOT holds key support levels and maintains bullish momentum, a larger reversal could be in play, making the next few trading sessions critical for determining its price trajectory.
Disclaimer: The information in this article is for general purposes only and does not constitute financial advice. The author’s views are personal and may not reflect the views of CoinB
rief.io. Before making any investment decisions, you should always conduct your own research. Coin Brief is not responsible for any financial losses.