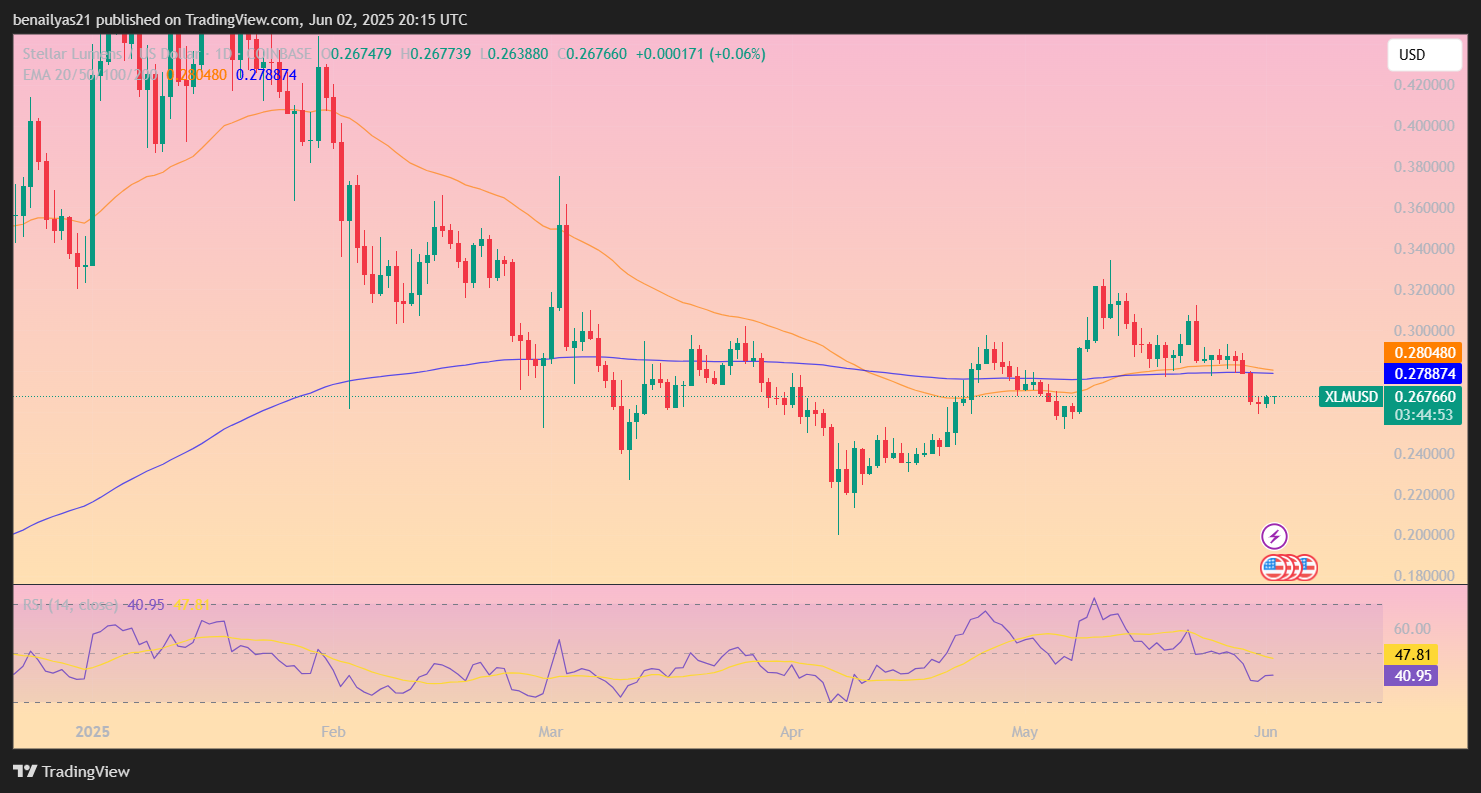
Stellar (XLM) has dropped 5.91% over the past week, now trading at $0.2637. While the decline reflects short-term weakness, analysts remain optimistic about a potential breakout. Since mid-April, XLM has been trading within a tight range between $0.24 and $0.30, with repeated support forming at $0.26. This consolidation phase suggests accumulation rather than capitulation, as buyers continue to defend the lower end of the range. Despite resistance at $0.30 halting previous rallies, market observers note that the persistence of demand signals strength beneath the surface.
Analyst Highlights Falling Wedge Breakout and Targets
According to Rose Premium Signals, XLM may be on the verge of a trend reversal. A falling wedge breakout on the 4-day chart is still intact, hinting at potential bullish continuation. The analyst points to Fibonacci retracement zones—particularly the 0.5 and 0.618 levels—as key inflection points where XLM has shown renewed strength. If support around $0.26 continues to hold, the next price targets are set at $0.4594, $0.5601, and $0.6719, aligning with historical resistance levels and Fibonacci projections. These targets suggest a gradual recovery path, provided the broader market remains supportive.
♾ #XLM/USDT 4D OUTLOOK$XLM is bouncing off key support and setting up for a trend reversal. The falling wedge breakout remains valid — all eyes on Fibonacci retracement levels for confirmation.
— Rose Premium Signals 🌹 (@VipRoseTr) June 1, 2025
🎯 Target 1: $0.4594
🎯 Target 2: $0.5601
🎯 Target 3: $0.6719
Structure still… pic.twitter.com/IKarpnjvx8
Momentum Indicators Suggest Caution Near-Term
Despite technical patterns indicating potential upside, momentum indicators are less convincing. XLM remains below its 20-day EMA ($0.2805) and 50-day EMA ($0.2789), which must be reclaimed for short-term bullish confirmation. The Relative Strength Index (RSI) stands at 40.95—below the neutral 50 mark—reflecting lingering bearish sentiment. Bollinger Bands further suggest weak momentum, with price action confined to the lower half of the range. The MACD indicator also shows limited enthusiasm, with both the MACD and signal lines below zero and no bullish crossover in sight.
While the broader structure suggests a possible breakout, Stellar will need to reclaim key technical levels and show stronger volume before confirming a sustained uptrend. Still, with strong support intact and bullish patterns forming, XLM remains a token to watch in the coming weeks.
Also Read: Stellar Lumens (XLM) at a Crossroads: Key Levels to Watch
Disclaimer: The information in this article is for general purposes only and does not constitute financial advice. The author’s views are personal and may not reflect the views of CoinBrief.io. Before making any investment decisions, you should always conduct your own research. Coin Brief is not responsible for any financial losses.