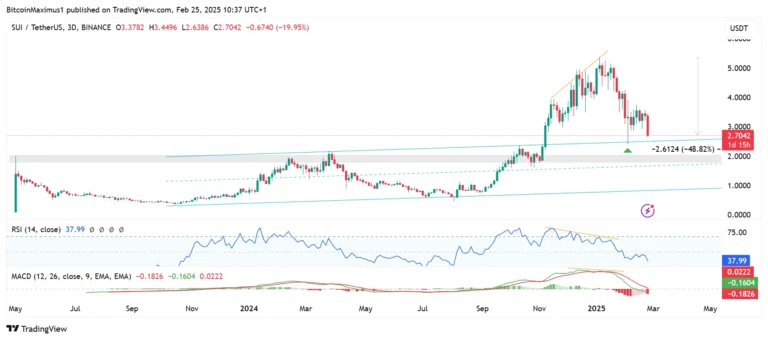
SUI’s impressive rally in late 2024 saw the cryptocurrency reach an all-time high of $5.37 on January 4, 2025. However, the momentum quickly faded, leading to a staggering 48% decline in less than two months. As of February 2025, SUI’s attempt at a recovery has failed, with bearish pressure overwhelming any upward movement.
SUI Price Faces Continued Decline
The 3-day chart paints a concerning picture for SUI holders. After reaching a low of $2.39 on February 3, SUI staged a brief recovery, forming a bullish candlestick. However, this bounce was short-lived, and most of its gains have already been erased. The failed recovery confirms the previous ascending parallel channel’s resistance trend line as a key support level.
If the current bearish trend continues, SUI risks falling back into the channel, which could signal prolonged weakness. The closest horizontal support level lies at $1.90, a significant 30% drop from current levels.

Technical Indicators Confirm Bearish Outlook
Key technical indicators reinforce the bearish sentiment. Both the Relative Strength Index (RSI) and the Moving Average Convergence/Divergence (MACD) have shown bearish divergences since SUI’s peak. The RSI has dipped into bearish territory, while the MACD line has crossed below the signal line, further validating downward pressure. These indicators suggest that another decline is likely in the near term.
New Lows Expected as Fifth Wave Unfolds
From a wave count perspective, SUI appears to be in the final stage of a five-wave downward movement that began after its January peak. The fourth wave formed a symmetrical triangle, which has now broken to the downside, reinforcing the bearish outlook.
If this count is correct, SUI could find a bottom between $1.51 and $1.90, where key Fibonacci retracement levels and horizontal support align. A break above $3.51 would invalidate this bearish scenario, but such a move seems unlikely given current market conditions.
Also Read: SUI’s Recovery Sparks Fresh Bullish Hopes: Key Price Targets and Resistance Levels to Watch
SUI’s price action suggests a continued decline toward the $1.90–$1.51 range. Unless bullish momentum returns, SUI holders may need to brace for further losses before any significant rebound occurs. Traders should watch key support levels for potential buying opportunities as the market navigates this bearish phase.
Disclaimer: The information in this article is for general purposes only and does not constitute financial advice. The author’s views are personal and may not reflect the views of CoinBrief.io. Before making any investment decisions, you should always conduct your own research. Coin Brief is not responsible for any financial losses.


