Uniswap (UNI) has recently rebounded from a critical support zone, showing promising signs of a potential trend reversal. The 4-hour chart indicates a breakout from a prolonged descending structure, while the 1-hour chart reveals key insights into short-term corrective movements and possible next steps.
UNI Price Analysis: Breaking the Downtrend
UNI had been in a sustained downtrend since reaching its peak of $19.35, forming a descending wedge. This pattern reached completion as UNI touched a major support zone between $5.40 and $6.00 on March 11, effectively retracing to a level where the last bullish phase began.
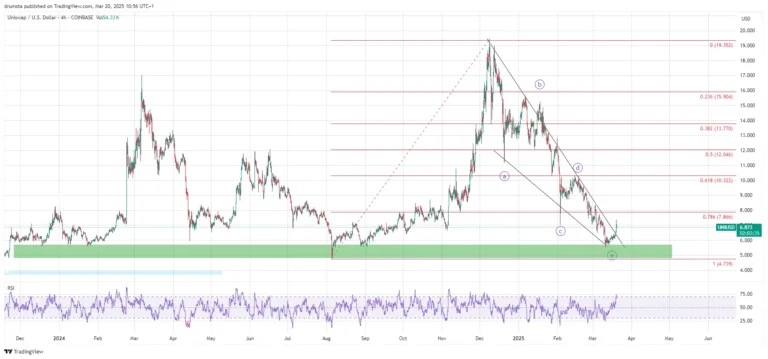
Following this support test, UNI bounced strongly, indicating the beginning of a new impulsive wave. The breakout aligns with a bullish divergence on the Relative Strength Index (RSI), confirming increasing buying momentum. UNI has now surpassed the initial resistance at $6.58 and is aiming for the $7.86 level, which coincides with the 0.786 Fibonacci retracement.
Elliott Wave and Fibonacci Analysis
Elliott Wave analysis suggests that UNI completed a five-wave corrective sequence (ABCDE) before its breakout. The next challenge for UNI lies at $7.86, historically a rejection zone. If UNI closes above this level, it could signal an extended rally toward $10.32 (0.618 Fibonacci retracement) and possibly $12.04 (0.5 Fibonacci retracement).
However, if UNI fails to hold above the breakout zone, it may retrace to $6.58 or even deeper to $5.40 before resuming its uptrend.
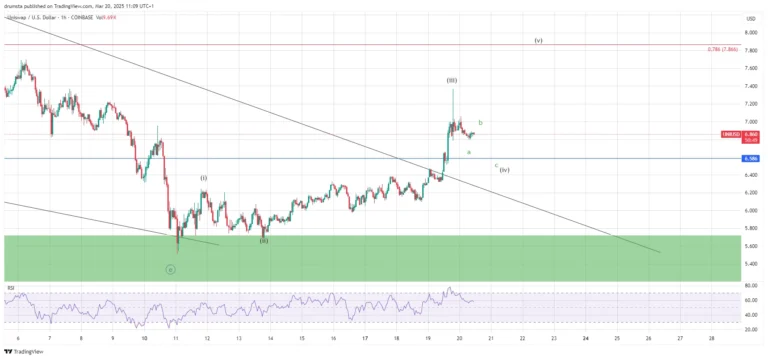
The 1-hour chart reveals an ongoing pullback, likely forming an (a)-(b)-(c) corrective structure within wave (iv). This correction may find support around $6.58 or $6.40 before a final wave (v) push towards $8.50.
A break above $7.86 could confirm bullish continuation, targeting higher resistance levels. Conversely, if UNI loses momentum and drops below $6.40, a deeper correction toward $6.00 could unfold, invalidating the current bullish setup.
Key Levels to Watch:
- Immediate Resistance: $7.86 (0.786 Fibonacci retracement)
- Key Resistance: $10.32 (0.618 Fibonacci retracement)
- Critical Resistance: $12.04 (0.5 Fibonacci retracement)
- Immediate Support: $6.58 (wave (iv) retracement zone)
- Critical Support: $6.00 (breakout retest)
- Short-Term Target: Above $8.50 if momentum sustains
- Invalidation Zone: Below $6.00, signaling further downside risk
Also Read: Uniswap (UNI) Nears Critical $3 Support: Key Levels and Whale Accumulation Signal Potential Reversal
With the breakout from a descending wedge and strong RSI signals, UNI’s recovery phase looks promising. However, holding key support levels will be crucial for continued upside momentum.
Disclaimer: The information in this article is for general purposes only and does not constitute financial advice. The author’s views are personal and may not reflect the views of CoinBrief.io. Before making any investment decisions, you should always conduct your own research. Coin Brief is not responsible for any financial losses.